

Using LLMs to group pathways by function

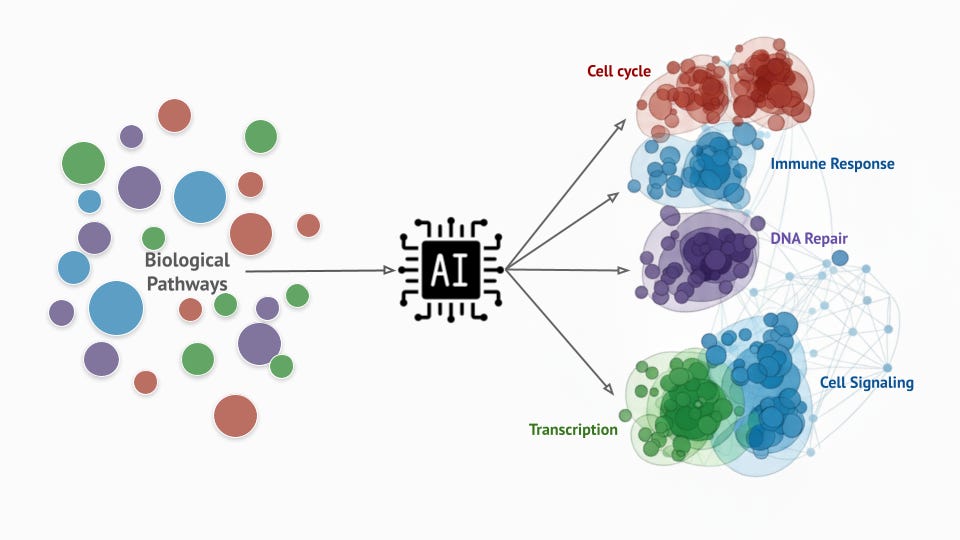
This summer we hosted Kalea-Meali’i Try, a high school student at Palo Alto High School. Kalea worked with the computational team to build a tool that groups pathways into functional groups based on their descriptions. Pathways are groups of genes that work together to conduct a variety of biological processes. The Molecular Signatures Database (mSigDB) contains curated sets of pathways that are frequently used to interpret gene expression data and translate gene-level responses into biological process level responses.
However, pathway analysis results pose a significant interpretive challenge. While these gene sets are derived to minimize gene overlaps there is still significant functional overlap between these sets. This leads to significant redundancy in results making it difficult to interpret for the user. At Transcripta, we regularly grapple with the challenge of interpreting pathway responses of 1000s of pathways across 100s of compounds and growing. To address this problem we used Gemini to generate mechanistic descriptions of pathways and used natural language processing (NLP) to group these descriptions into a much smaller set of higher-level functional categories making interpretation that much easier.
Generation of pathway descriptions with Google Gemini
We started by generating pathway descriptions for Reactome, WikiPathways, and Biocarta pathways (total 2800 pathways). These three sets were chosen as they encompass major signaling and metabolic functional annotations. For each pathway, Gemini was queried using Google’s API with the ‘gemini-2.0-flash’ model. The model was provided the pathway name and description (from the respective database) as priors.
One might wonder as to the need of LLM-generated descriptions if descriptions for these pathways are already available. A key reason behind this was to generate coherent and harmonized descriptions because each database might provide slightly different styles of descriptions. For example, Reactome descriptions tend to be entirely mechanistic, like gene X activates gene Y etc. while those from Biocarta might be entire prose style abstracts from a publication. These differences can then affect downstream analysis and skew results.
To highlight the importance of coherent and harmonized descriptions generated using Gemini we used a pre-trained sentence transformer model to embed both raw and LLM-generated descriptions in a reduced vector space. This model is based on BioBERT, a domain-specific language representation model based on BERT (Bidirectional Encoder Representations from Transformers), pre-trained on large-scale biomedical corpora including PubMed abstracts and PMC full-text articles making it better suited for biomedical texts. Embedding text into a vector space converts complex textual data into numerical matrices. In essence, it translates language into numbers so that algorithms can recognize patterns, similarities, and relationships in text the way humans understand context. They most importantly also enable visualization, like the ones shown in figure 1, panels A-B in a 2D space.
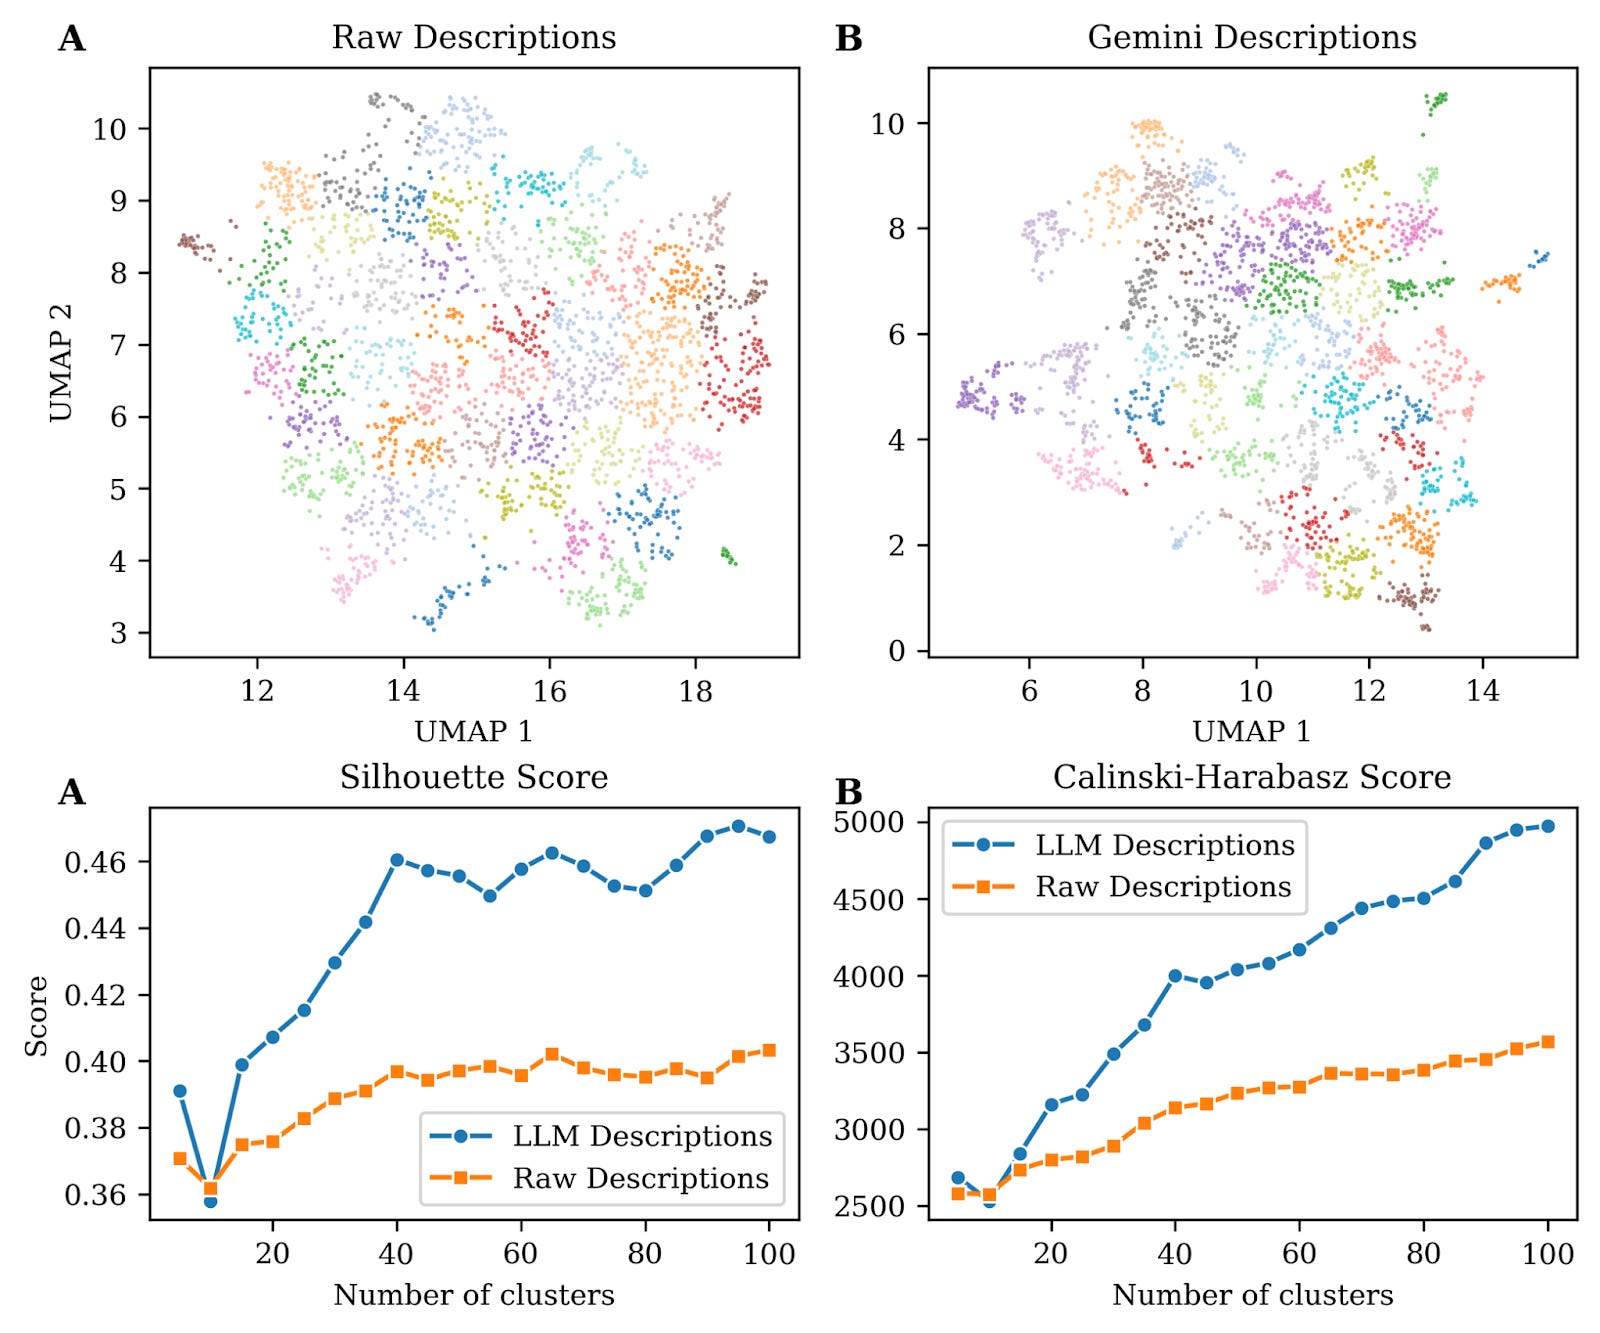
Visual inspection of these two panels show that descriptions generated using an LLM form better cluster structure, i.e. groups of points are more distinct and separated from other groups. This observation can be validated using mathematical frameworks to evaluate cluster quality such as Silhouette scores (reflecting intra-cluster cohesion) and Calinski-Harabasz index (reflecting inter-cluster separation) (Fig. 1C-D) both showing superior performance with LLM-generated descriptions.
Grouping pathways using LLM-generated mechanistic descriptions
We used embeddings of LLM descriptions to group pathways into functional groups using topic modeling. Topic modeling is applied to text data to automatically uncover themes in this data, for example to categorize movie synopsis into genres. It can, in this case, be used to organize and summarize complex pathway descriptions by grouping pathways that share similar functions, mechanisms, or underlying biology.
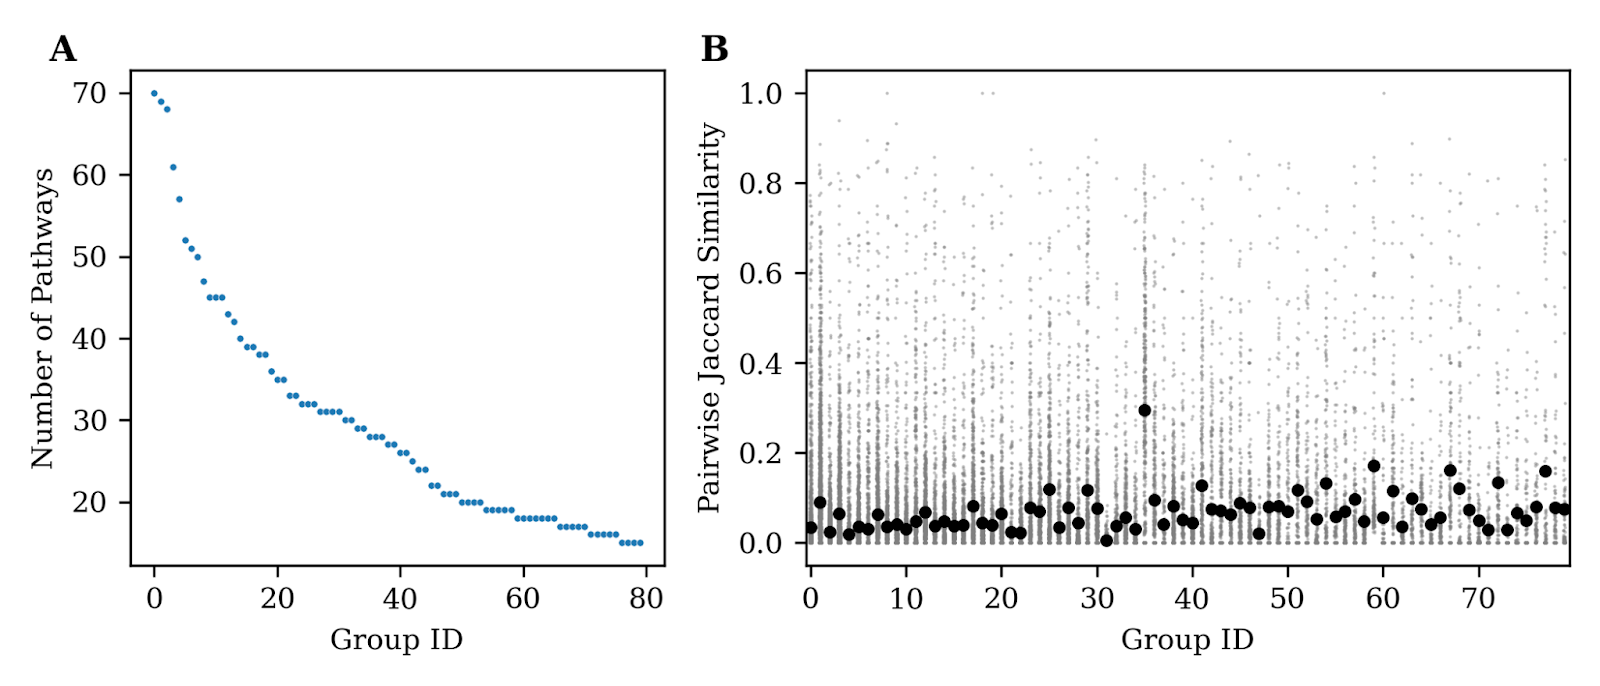
~85% of the 2,800 pathways were successfully grouped into <100 groups (Fig. 2A) of 25-70 pathways. We wanted to make sure these pathway groups weren’t simply based on gene set similarity, such that each pathway group was just made of pathways that shared lots of genes. To do this we computed the pairwise Jaccard Similarity of genes for pathways in each group and found that the mean similarity for groups was <0.5 showing that gene similarity does not by itself account for information contained in each group (Fig. 2B). This is good news because it means these groups are not simply based on similar gene sets but more so on broader similarity encoded in the biological function.
This is also demonstrated by individually examining groups and the function of each pathway in the group. For example, one of the groups corresponds to a cluster of 42 pathways associated with MAPK signaling pathways.
Biological applications of pathway groups
Much like pathway analysis that uses groups of genes to infer response for each pathway, these pathway groups can be used in a similar analysis except for sets of pathways instead of genes to estimate response for each pathway group.
To illustrate this, we randomly picked a CDK4/Cyclin D1, CDK2/Cyclin E and Protein Kinase C (PKC) Inhibitor with a reported PKC IC50 of 0.12 µM from the Novartis MoA Box dataset. CDK2/CDK4 plays an important role in cell cycle maintenance and its inhibition leads to cell cycle arrest. Panels in figure 4 show enrichment (response>0) or de-enrichment (response<0) of these pathway groups. The x-axis shows the magnitude of response measured by a “normalized enrichment score” and the y-axis shows significance (values > 1 are significant).
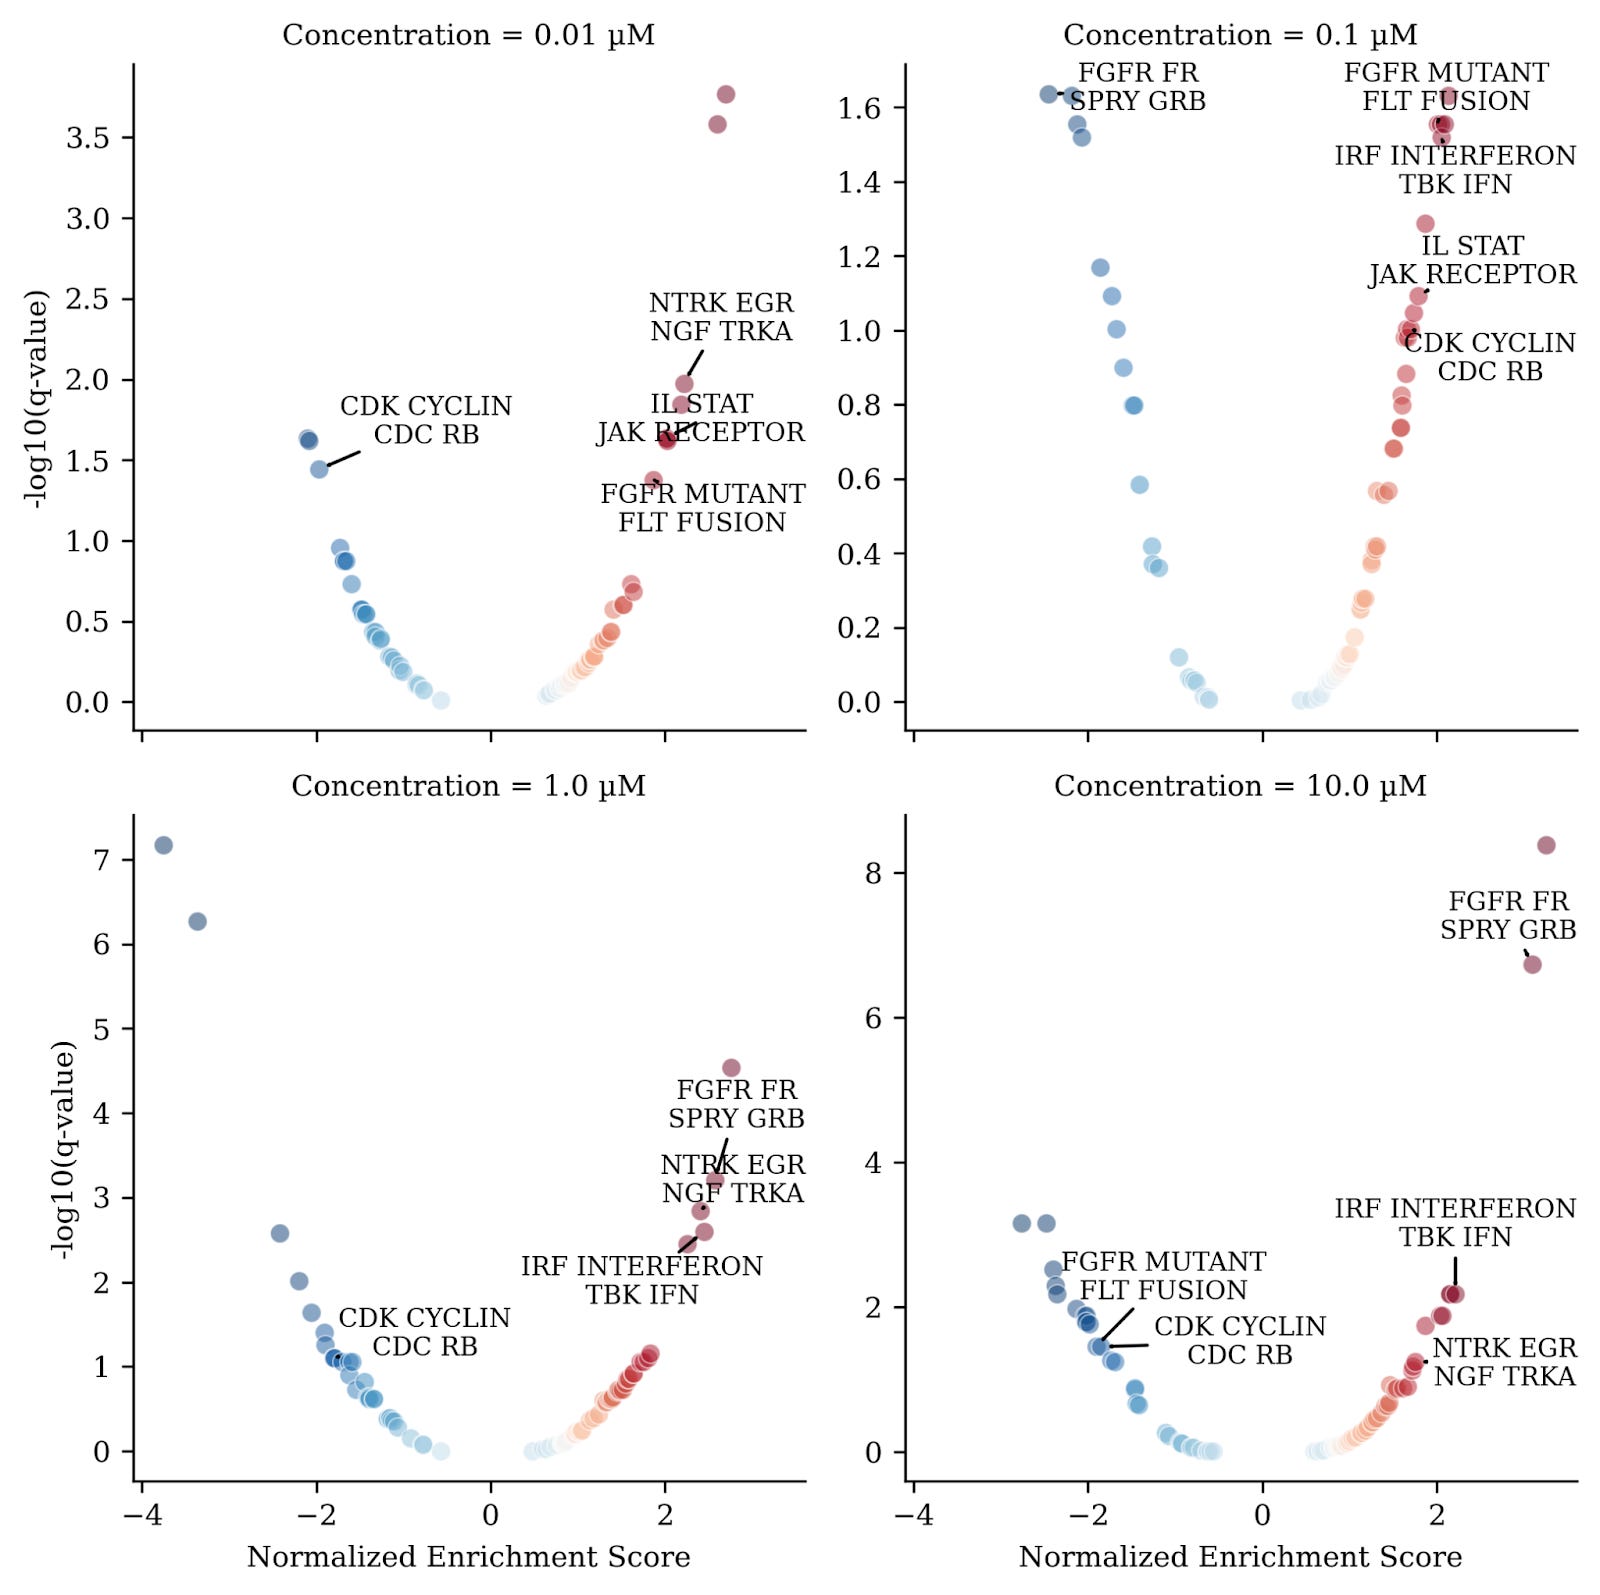
Interpreting results of analysis of pathway groups was much simpler since redundancy in these groups is minimal and the user is required to only interpret a small number of significantly regulated functional groups before drilling down into detailed per pathway results. Moreover, grouping pathways in this manner also reduces noise in the signal and only reveals coherent functional activity hubs whereas per-pathway results are generally noisier.
Our results quickly revealed that a group of pathways associated with CDKs (“CDK CYCLIN CDC RB”) were down-regulated for 3 out of the 4 concentrations (Fig. 4), as would be expected for a compound annotated as a CDK2/CDK4 inhibitor. We also observed enrichment of a signaling pathway group associated with “NTRK EGR NGF TRKA”. This is an interesting observation because binding of the protein NGF to the receptor TRKA increases EGR expression and activates both PKC and CDK2/CDK4 signaling cascades. The activation of this group of pathways potentially points to a compensatory mechanism in response to the inhibition of PKC/CDK2/CDK4.
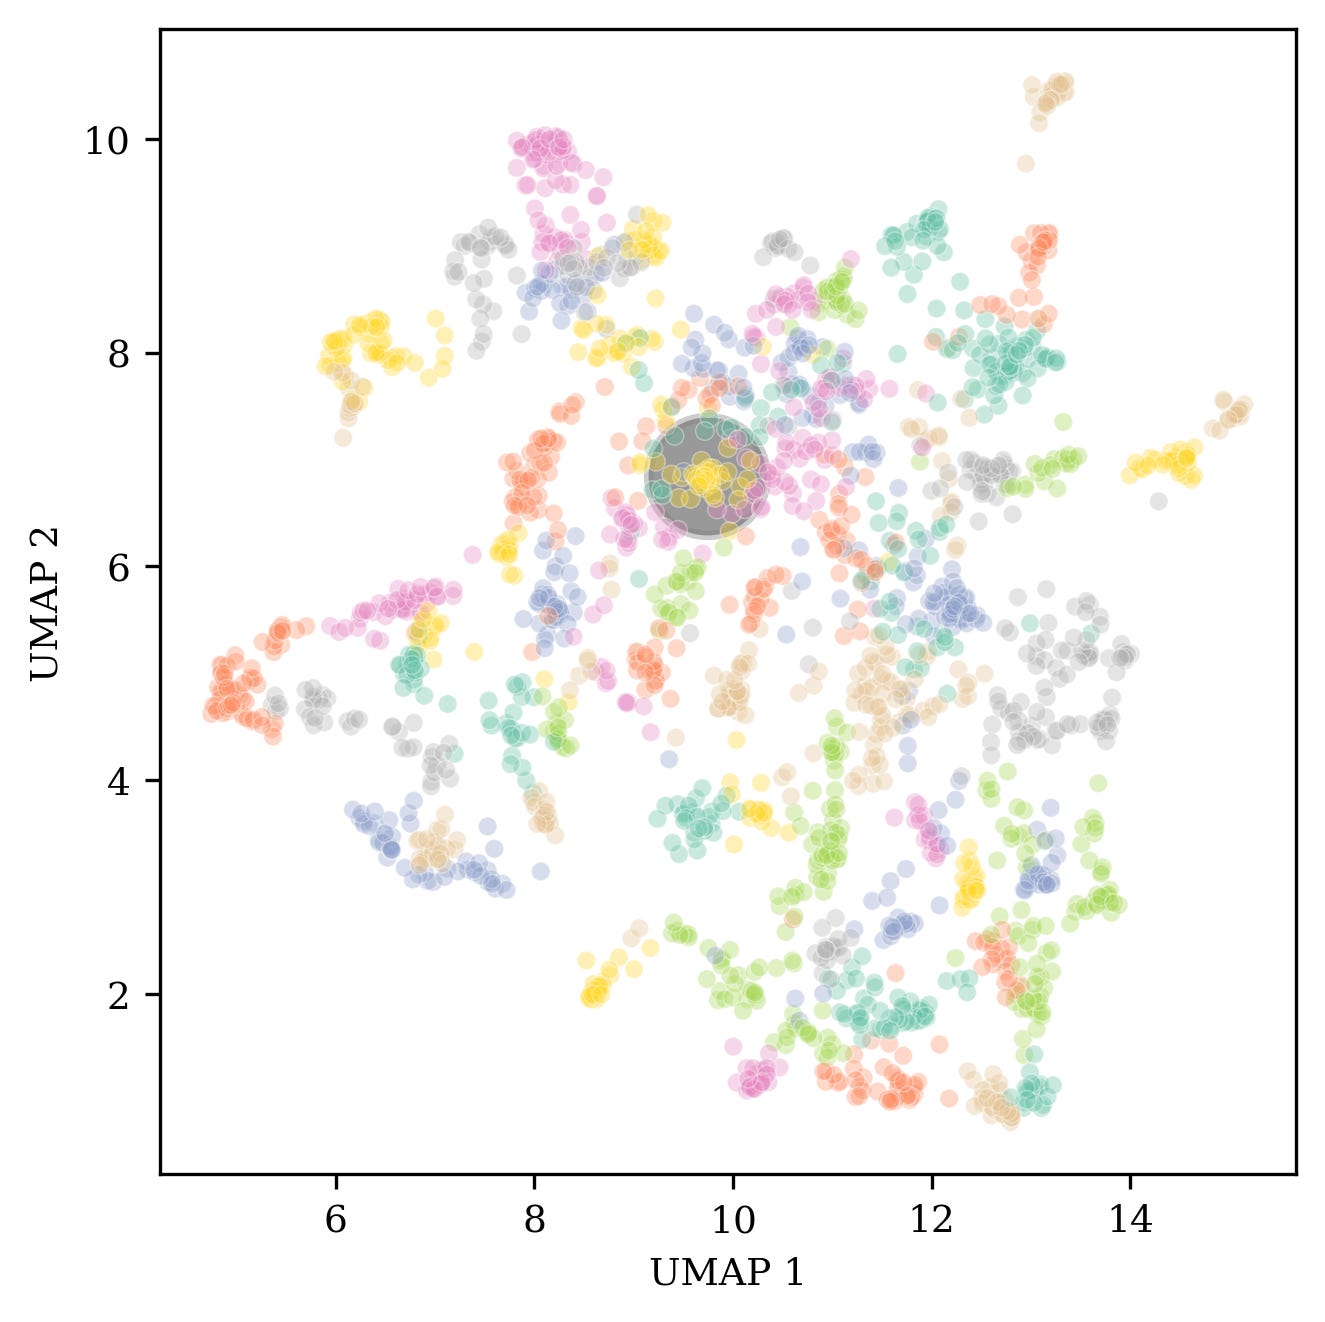
Finally we observed a cluster of other signaling pathway groups (labeled in figure 4) that were also activated across 3 out of the 4 concentrations. Interestingly, these pathway groups clustered closely together, based on topic similarity, with the group of NTRK/EGR/NGF/TRKA pathways (Fig. 5).
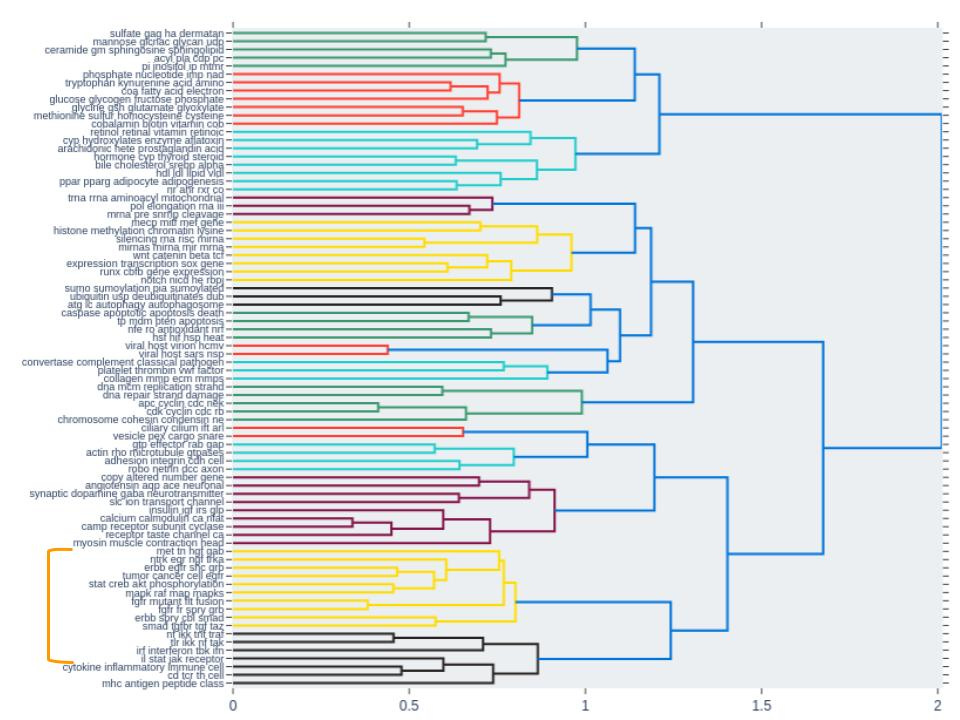
This provided an additional level of validation that these pathway groups mimic biological function where similar groups of pathways (predicted by topic similarity) are also co-activated during drug treatment.
Conclusions
This is one of the ways in which Transcripta is integrating LLMs with omics data to power discovery and interpretation of cellular function. While LLMs are directly useful and widely used for interpretation of scientific data, they are also becoming very useful for us to power downstream analytical tools such as this one.
This project specifically demonstrated the efficacy of using LLMs to enhance the interpretability of pathway analysis results. By generating coherent and harmonized mechanistic descriptions, and subsequently employing natural language processing and topic modeling, pathways can be grouped into functionally relevant categories. This approach significantly reduces redundancy, simplifies interpretation for users, and reveals coherent functional activity hubs, as evidenced by improved cluster quality metrics and biological validation through drug treatment experiments. These findings suggest a useful new method for analyzing complex gene expression data, offering a clearer and more efficient path to understanding biological processes at a functional level.